For years, product teams focused heavily on building features but spent far less time understanding how users actually discovered and adopted those features. Walkthroughs and onboarding flows were often treated as simple tutorials helpful but not strategically measured.
That mindset is changing rapidly.
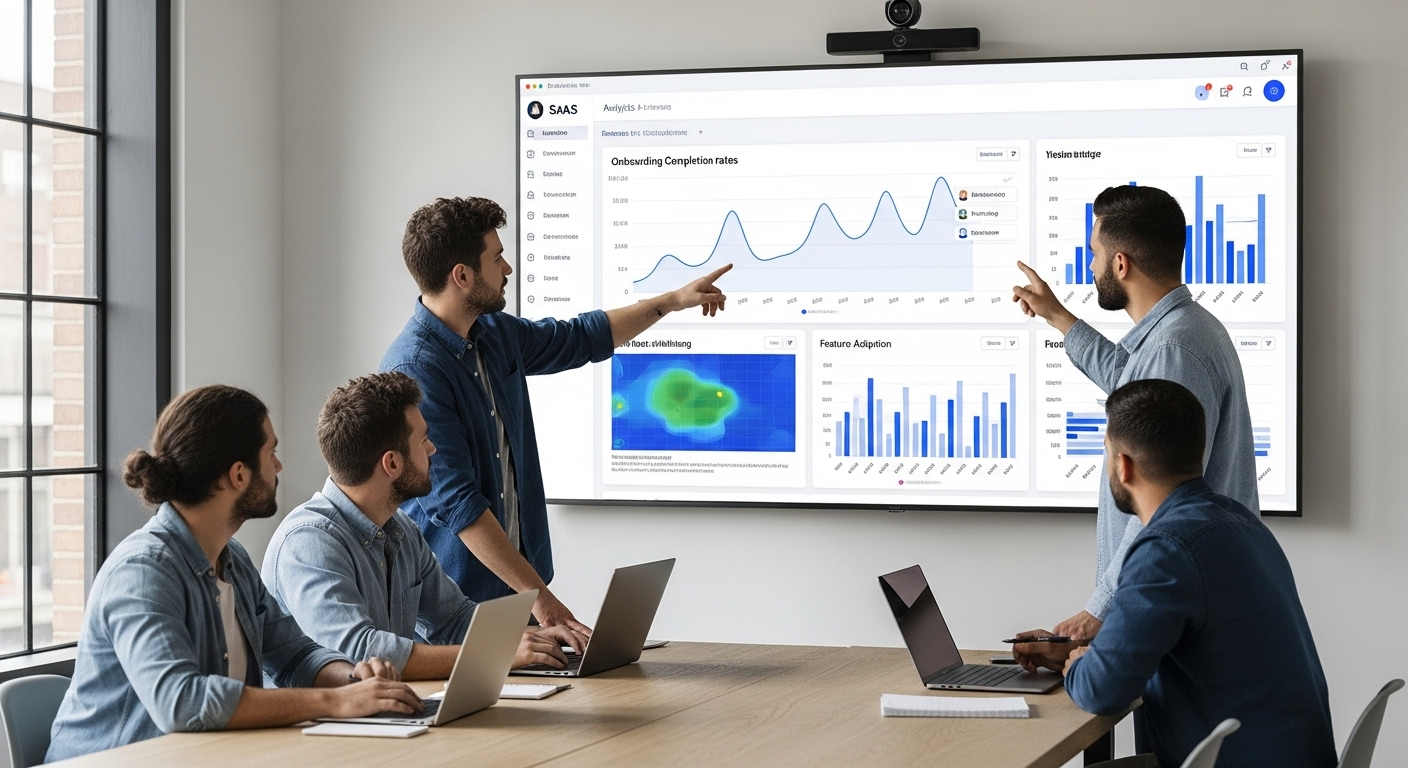
In 2026, feature walkthrough analytics is becoming a standard component of product development and user experience strategy. Product teams now measure how users interact with walkthroughs, how effectively they activate features, and how onboarding experiences influence long-term engagement.
Feature walkthroughs are no longer just instructional overlays. They are now measurable growth tools.
The Evolution of Feature Walkthroughs
Early software products relied primarily on documentation, FAQ pages, or video tutorials to explain functionality. Users were expected to explore interfaces and learn features independently.
Later, product teams introduced guided walkthroughs, including:
- Tooltips explaining buttons
- Step-by-step onboarding tours
- Feature announcement pop-ups
- Interactive product tours
While these improvements helped reduce confusion, many companies still lacked visibility into how users engaged with those walkthroughs.
Product teams could launch onboarding flows but they often had no way of knowing whether those flows actually worked.
Why Feature Walkthrough Analytics Matters
Feature walkthrough analytics provides data-driven insights into how users interact with onboarding experiences. Instead of assuming that guidance works, product teams can measure real outcomes.
This shift allows companies to answer key questions such as:
- Do users complete onboarding tours?
- Which steps cause users to drop off?
- How quickly do users activate key features?
- Which walkthroughs drive higher retention?
- Are new features being discovered effectively?
These insights help teams continuously optimize product experiences.
Key Metrics in Feature Walkthrough Analytics
Modern product teams monitor several important indicators when evaluating walkthrough performance.
Walkthrough Completion Rate
This metric tracks how many users finish an onboarding sequence.
Low completion rates often indicate:
- Too many steps
- Confusing instructions
- Poor timing of walkthrough triggers
Optimizing completion rates improves early product adoption.
Feature Activation Rate
Activation rate measures how many users actually use a feature after being guided through a walkthrough.
High activation rates signal effective onboarding.
Low activation rates may indicate that:
- The feature is difficult to understand
- The walkthrough lacks clarity
- The feature does not solve a meaningful user problem
Time to First Value
Time to first value measures how quickly users experience meaningful benefits from a product.
Feature walkthrough analytics helps reduce this timeline by guiding users toward impactful features earlier in the journey.
The faster users reach value, the higher the retention rate.
Walkthrough Drop-Off Points
Analyzing where users exit a walkthrough provides critical insights into usability problems.
Common causes of drop-off include:
- Overly long onboarding flows
- Irrelevant feature explanations
- Poor user interface design
- Cognitive overload
Shorter, focused walkthroughs often perform better.
Feature Adoption Rate
Feature adoption analytics measure how many users incorporate a feature into regular workflows after onboarding.
This metric helps product teams determine whether a feature provides sustained value or requires redesign.
Feature Walkthrough Analytics and Product-Led Growth
Many modern SaaS companies operate under a product-led growth (PLG) model, where the product itself drives acquisition, activation, and expansion.
In PLG environments, feature walkthroughs play a critical role in:
- Educating new users
- Encouraging feature discovery
- Driving upgrades
- Reducing customer support demand
Walkthrough analytics ensures that onboarding experiences contribute directly to growth metrics.
Behavioral Triggers and Contextual Walkthroughs
Feature walkthrough analytics also enable more intelligent onboarding strategies.
Instead of forcing every user through the same product tour, modern platforms use behavioral triggers.
Walkthroughs can activate when:
- A user opens a feature for the first time
- A user completes a milestone
- A user struggles with a workflow
- A new feature is introduced
This context-aware guidance improves engagement and reduces friction.
Micro-Walkthroughs: The New Standard
Traditional onboarding tours often contained long sequences of steps that overwhelmed users.
Today, many companies are replacing these with micro-walkthroughs short, targeted guidance moments tied to specific features.
Micro-walkthroughs provide:
- Faster learning experiences
- Lower cognitive load
- Higher completion rates
- More contextual help
Analytics confirms that smaller, focused guidance moments perform better than lengthy tutorials.
The Role of Product Analytics Platforms
Modern analytics platforms now integrate directly with feature walkthrough systems. These tools track user behavior across the entire onboarding journey.
Product teams can combine walkthrough analytics with:
- User session recordings
- Funnel analysis
- Cohort analysis
- Retention metrics
This integrated view provides deeper insights into product adoption patterns.
Benefits for Product Teams
Companies that implement feature walkthrough analytics gain several advantages.
Improved User Onboarding
Analytics-driven improvements help remove friction in early product experiences.
Faster Feature Adoption
Clear guidance increases the likelihood that users explore and adopt advanced features.
Reduced Support Costs
Better onboarding reduces the number of help requests and support tickets.
Higher User Retention
When users quickly understand product value, they are more likely to remain active customers.
Challenges in Implementing Walkthrough Analytics
Despite its advantages, implementing walkthrough analytics requires careful planning.
Some challenges include:
- Avoiding excessive guidance that annoys users
- Ensuring analytics data remains actionable
- Aligning onboarding flows with real user workflows
- Maintaining consistency across product updates
Successful companies treat walkthrough analytics as an ongoing optimization process rather than a one-time implementation.
The Future of Feature Walkthrough Analytics
Looking ahead, feature walkthrough analytics will likely become even more intelligent.
Emerging trends include:
- AI-driven onboarding recommendations
- Predictive feature adoption modeling
- Automated walkthrough optimization
- Personalized guidance experiences
Product teams will increasingly rely on analytics to design onboarding experiences that evolve with user behavior.
Conclusion
Feature walkthrough analytics is becoming a standard practice because modern product teams need measurable insights into how users learn and adopt software.
Walkthroughs are no longer static tutorials. They are dynamic product adoption systems that influence activation, retention, and growth.
By measuring completion rates, activation metrics, and adoption patterns, organizations can continuously improve onboarding experiences and unlock the full value of their products.
In the product-led era, successful companies do not just build features they ensure users actually discover and use them.
Feature walkthrough analytics makes that possible.
For more Contact Us
Similar Posts

Product & Tools
The Powerful Rise of AI-Powered Tools Over Traditional Software in 2026
The global software industry is experiencing one of the most important technological transformations in decades. Businesses that once…

Product & Tools
Usage-Based Pricing Is Replacing Traditional SaaS Plans
The SaaS (Software-as-a-Service) industry is entering a completely new era. For more than two decades, subscription-based software pricing…