
Exploratory Testing Improves Modern Manual Testing Strategies

For decades, manual testing played a foundational role in software quality assurance. Testers executed predefined test cases, followed structured test scripts, and validated whether applications behaved according to documented requirements. This systematic approach ensured consistency and traceability, making it a cornerstone of traditional QA processes.

However, the landscape of software development has changed dramatically. Modern applications are increasingly complex, dynamic, and continuously evolving. Cloud-native architectures, microservices, AI-powered systems, and rapid deployment cycles have introduced new challenges that traditional scripted testing alone cannot fully address.

As automation tools handle more repetitive validation tasks, manual testing is undergoing a transformation. Today, manual testers are shifting toward exploratory testing, an investigative and adaptive approach that prioritizes creativity, critical thinking, and real-time discovery.

Exploratory testing is redefining the role of human testers in modern quality engineering.

The Traditional Model of Manual Testing

In traditional QA environments, manual testing followed a structured methodology. Test plans were created early in the development cycle, and testers executed detailed scripts designed to validate specific application behaviors.

Typical manual testing tasks included:

  • executing regression test suites
  • validating functional requirements
  • verifying user interface behavior
  • confirming expected outputs for specific inputs
  • documenting test results and defect reports

This approach ensured repeatability and helped maintain documentation for compliance and audit purposes. However, it also imposed limitations on how testers interacted with software.

Testers often focused on verifying what was expected rather than discovering what was unexpected.

The Limitations of Script-Based Testing

While scripted testing remains valuable, it struggles to capture the unpredictable nature of real-world user behavior.

Limited Flexibility

Test scripts define specific steps and expected outcomes. While this ensures coverage of planned scenarios, it restricts testers from deviating from the predefined path.

In many cases, unexpected behaviors only emerge when users interact with systems in ways that designers did not anticipate.

Difficulty Identifying Edge Cases

Edge cases often arise from unusual combinations of inputs, actions, or environmental conditions. These situations are rarely included in predefined scripts.

Exploratory testing allows testers to intentionally explore these unusual paths.

High Maintenance in Agile Environments

In fast-moving development environments, applications change frequently. Maintaining large libraries of scripted test cases can become time-consuming.

Scripts may quickly become outdated when features evolve, requiring continuous updates.

Understanding Exploratory Testing

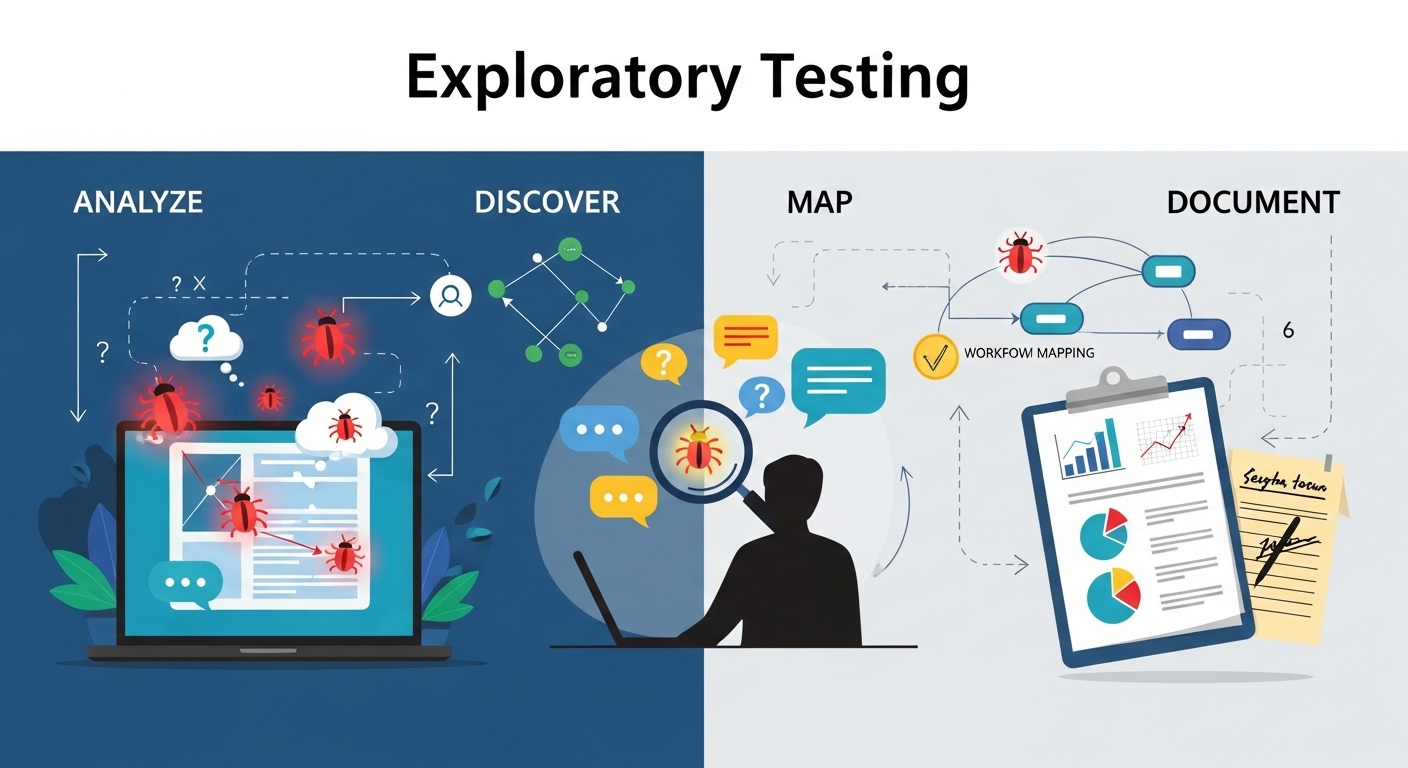
Exploratory testing is an approach where testers simultaneously learn about the application, design tests, and execute them.

Rather than following strict scripts, testers explore the system interactively, using their experience and intuition to investigate how the software behaves under different conditions.

This approach emphasizes:

  • curiosity-driven testing
  • real-time hypothesis creation
  • dynamic scenario exploration
  • creative problem discovery

Exploratory testing encourages testers to think like users, hackers, and system analysts simultaneously.

Why the Industry Is Embracing Exploratory Testing

Several trends are accelerating the shift toward exploratory testing.

Automation Handles Routine Tasks

Automation frameworks are highly effective at performing repetitive verification tasks, such as:

  • form validation
  • API response testing
  • data integrity checks
  • regression testing

Automated scripts can run thousands of tests quickly and consistently, freeing manual testers to focus on areas that require human insight.

Increasing Application Complexity

Modern software ecosystems include multiple interacting components, such as:

  • distributed microservices
  • cloud infrastructure
  • third-party integrations
  • mobile and web platforms
  • AI and machine learning modules

These interconnected systems create unpredictable interactions that automated scripts may fail to detect.

Exploratory testing helps identify issues that emerge from these complex interactions.

Continuous Deployment Demands Faster Feedback

Agile and DevOps practices emphasize frequent releases. Applications may be deployed multiple times per day.

Traditional test design cycles cannot always keep pace with rapid development.

Exploratory testing allows testers to quickly evaluate new features without waiting for formal scripts to be written.

Focus on User Experience

Modern applications must deliver seamless and intuitive experiences.

While automated tests verify functionality, they cannot evaluate whether an application feels intuitive or whether workflows make sense to users.

Exploratory testers evaluate software from the perspective of real users, identifying usability challenges that automated tests cannot detect.

Key Advantages of Exploratory Testing

Exploratory testing provides several benefits that make it essential in modern QA strategies.

Early Detection of Critical Issues

Exploratory testers often identify critical defects early because they actively investigate system behavior rather than passively executing scripts.

Realistic User Simulation

Human testers can replicate unpredictable user behaviors, such as:

  • entering unexpected input values
  • navigating interfaces non-linearly
  • combining features in unusual ways

These behaviors often reveal hidden defects.

Increased Test Coverage

Exploratory testing expands coverage beyond predefined test cases. By exploring different workflows, testers uncover edge cases that scripted tests may overlook.

Faster Feedback for Developers

Exploratory testing sessions can quickly identify areas of concern, enabling developers to address issues earlier in the development cycle.

Session-Based Exploratory Testing

To bring structure to exploratory testing, many teams adopt session-based testing frameworks.

In session-based testing, testers work within defined time blocks (sessions) focused on specific goals.

Each session typically includes:

  • a defined test objective
  • a time limit (often 60–90 minutes)
  • detailed notes on discoveries
  • documentation of defects or insights

This approach combines the creativity of exploratory testing with the discipline required for professional QA processes.

Tools That Support Exploratory Testing

Several modern tools help testers conduct exploratory testing more effectively. These tools assist with:

  • recording test sessions
  • capturing screenshots or screen recordings
  • documenting tester observations
  • tracking discovered defects
  • integrating findings with issue tracking systems

Some tools also generate reports that help teams understand which areas of the application were explored during testing sessions.

The Changing Role of QA Professionals

As exploratory testing becomes more prominent, the role of manual testers is evolving.

Modern QA professionals must develop new skills, including:

  • critical thinking and analytical reasoning
  • understanding system architecture
  • strong communication skills
  • familiarity with automation tools
  • awareness of security and performance risks

Rather than acting as script executors, testers increasingly function as quality investigators who explore systems from multiple perspectives.

Balancing Automation and Exploratory Testing

Exploratory testing works best when combined with automated testing.

Automation excels at:

  • repetitive regression tests
  • large-scale data validation
  • performance benchmarking
  • API testing

Exploratory testing excels at:

  • discovering unexpected defects
  • evaluating usability
  • identifying workflow issues
  • testing complex scenarios

Together, these approaches create a comprehensive quality assurance strategy.

Challenges in Exploratory Testing

Despite its advantages, exploratory testing presents challenges that teams must address.

Documentation and Traceability

Because exploratory testing is less scripted, documenting the exact steps taken during testing sessions can be difficult.

Session-based frameworks help mitigate this challenge.

Measuring Test Coverage

Traditional test cases provide clear coverage metrics. Exploratory testing requires alternative methods for measuring coverage.

Some teams use charters or coverage maps to track explored areas.

Skill Requirements

Exploratory testing requires experienced testers who understand both user behavior and technical systems.

Training and mentoring are essential for developing these skills.

The Future of Manual Testing

Manual testing is not disappearing. Instead, it is evolving into a more strategic discipline that focuses on human insight.

Future manual testing roles will likely include:

  • exploratory testing leadership
  • user experience validation
  • accessibility testing
  • AI behavior testing
  • security-oriented testing

As automation continues to expand, human testers will increasingly focus on areas where creativity, judgment, and intuition provide the greatest value.

Conclusion

Manual testing is shifting toward exploratory testing because modern software systems require deeper investigation and human insight. While automation continues to improve efficiency and coverage, it cannot fully replace the creativity and adaptability of human testers.

Exploratory testing enables QA professionals to uncover hidden defects, evaluate user experiences, and adapt quickly to evolving software environments.

In the future of software quality engineering, automation will handle routine validation, while exploratory testers will play a critical role in discovering the unexpected.

Together, these approaches will ensure that software is not only functional but also resilient, intuitive, and reliable

For more Contact US
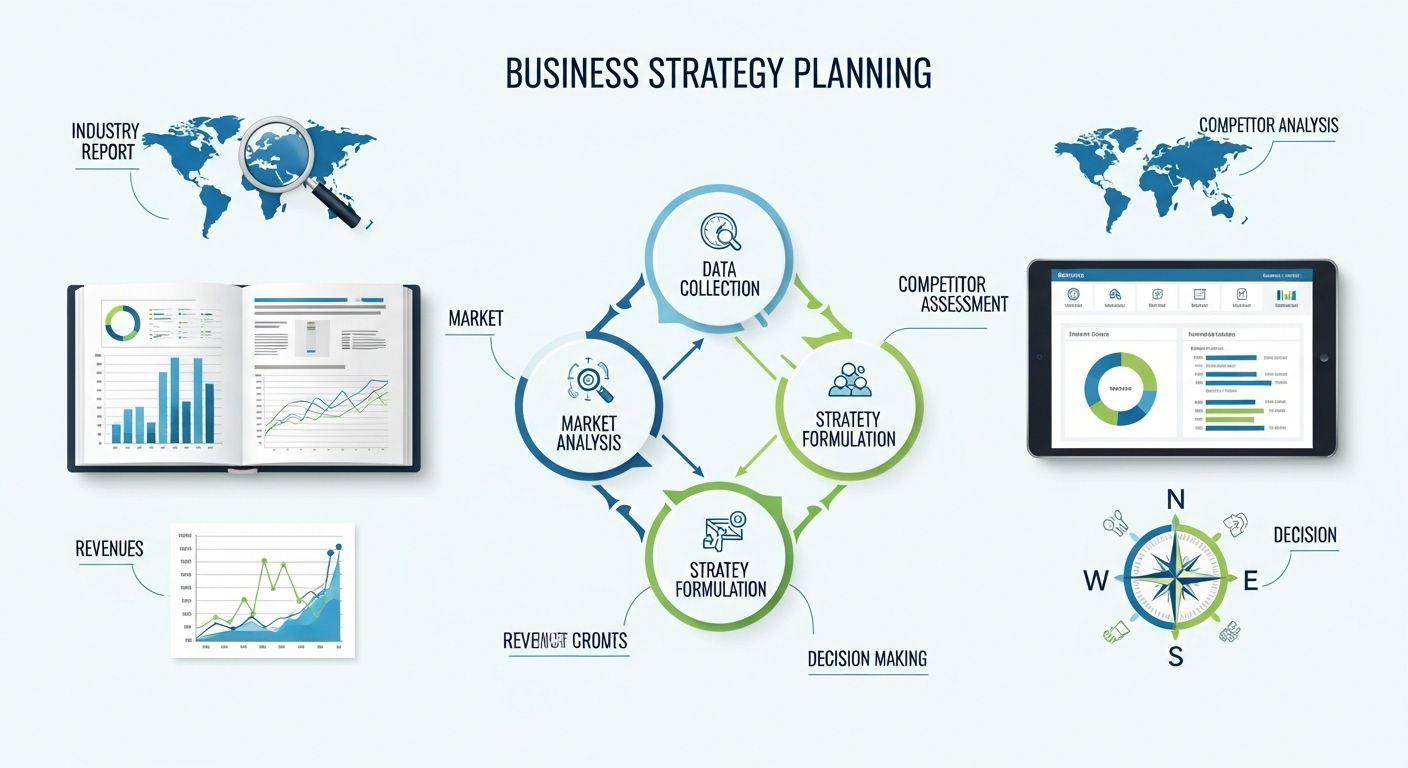
Industry Reports Deliver Powerful Insights for Better Business Strategy

For decades, industry reports were primarily viewed as research documents used by analysts, consultants, and corporate strategists to understand market trends. They were often produced annually, stored as lengthy PDFs, and used mainly for background information rather than direct decision-making.

That role is changing rapidly.

In today’s fast-moving digital economy, industry reports are evolving into strategic decision tools that influence product development, investment strategies, competitive positioning, and long-term business planning. Organizations are no longer treating reports as passive reading material they are integrating industry insights directly into operational and strategic workflows.

Industry intelligence has moved from reference material to real-time decision infrastructure.

The Evolution of Industry Reports

Traditionally, industry reports were produced by market research firms, consulting companies, or financial institutions. These reports focused on broad analyses such as:

  • Market size and growth forecasts
  • Competitive landscapes
  • Emerging technology trends
  • Consumer behavior patterns
  • Regulatory changes

While these reports were useful, they often suffered from one key limitation: they were static.

By the time a report was published, parts of the market landscape might already have changed. This meant companies often relied on outdated insights when making critical decisions.

Today’s business environment demands faster intelligence.

Why Industry Reports Are Becoming Strategic Assets

Several major shifts are transforming how organizations use industry research.

1. Faster Market Changes Require Faster Insights

Markets now evolve much more quickly than they did even a decade ago. Technology innovation, digital transformation, and global competition accelerate change across industries.

Companies must constantly monitor:

  • competitor movements
  • emerging technologies
  • shifting customer expectations
  • regulatory updates
  • macroeconomic trends

Modern industry reports increasingly provide continuous insights rather than periodic summaries, enabling businesses to react faster.

2. Data-Driven Decision-Making Is Now Essential

Organizations today rely heavily on data-driven strategies. Executives expect decisions to be supported by:

  • market evidence
  • competitive intelligence
  • financial projections
  • trend analysis

Industry reports provide the external context necessary to interpret internal business data.

For example, a company experiencing declining product adoption might use industry reports to determine whether the issue reflects internal execution problems or broader market shifts.

3. Competitive Intelligence Has Become Critical

Companies now face competition not only from traditional rivals but also from startups, technology disruptors, and cross-industry entrants.

Industry reports help businesses analyze:

  • competitor product strategies
  • investment patterns
  • pricing models
  • innovation trends

This competitive intelligence helps organizations anticipate market shifts before they occur

4. Investors Depend on Industry Insights

Venture capital firms, private equity investors, and institutional funds rely heavily on industry reports to evaluate opportunities.

Before funding a company, investors analyze:

  • market growth potential
  • sector risk factors
  • regulatory environments
  • technological disruption potential

Industry research therefore plays a central role in investment decisions.

Industry Reports and Strategic Planning

One of the most important ways industry reports influence organizations is through strategic planning.

Executives use industry research to support decisions such as:

Market Entry Strategies

When companies consider entering new markets or launching new products, they rely on industry reports to understand:

  • demand forecasts
  • regional competition
  • regulatory requirements
  • potential barriers to entry

This reduces risk and improves planning accuracy.

Product Development Decisions

Industry insights help companies determine which technologies and features customers are likely to value in the future.

For example, reports highlighting growth in AI adoption or cybersecurity threats can influence product roadmaps.

Organizations increasingly align their innovation strategies with emerging trends identified in industry research.

Risk Management

Industry reports also help companies identify external risks.

These risks may include:

  • regulatory changes
  • supply chain disruptions
  • economic downturns
  • technological disruption

By identifying these risks early, organizations can develop mitigation strategies before problems arise.

The Rise of Interactive and Real-Time Industry Intelligence

Modern industry reports are becoming more dynamic.

Instead of static documents, many research platforms now offer:

  • real-time market dashboards
  • interactive data visualizations
  • customizable datasets
  • predictive trend analysis

This allows decision-makers to explore data in ways that were previously impossible with traditional reports.

Executives can now filter insights by geography, market segment, or time period to identify relevant trends quickly.

AI and the Future of Industry Research

Artificial intelligence is also transforming how industry reports are created and used.

AI-powered analytics tools can process enormous volumes of data from sources such as:

  • financial filings
  • news publications
  • social media signals
  • economic indicators
  • technology adoption patterns

These systems can identify trends and patterns far faster than manual analysis.

As a result, industry reports are becoming more predictive and forward-looking rather than purely descriptive.

Benefits of Using Industry Reports as Strategic Tools

Organizations that integrate industry intelligence into decision-making gain several advantages:

Better Strategic Alignment

Companies can align internal strategies with external market trends.

Faster Decision-Making

Real-time insights enable executives to respond quickly to emerging opportunities or risks.

Reduced Uncertainty

Market research provides evidence-based guidance, reducing reliance on assumptions.

Stronger Competitive Positioning

Companies can anticipate competitor strategies and prepare accordingly.

Challenges in Using Industry Reports Effectively

Despite their value, industry reports must be used carefully.

Common challenges include:

  • overreliance on outdated reports
  • misinterpretation of data trends
  • analysis paralysis from excessive information
  • reliance on generalized insights that may not apply to specific businesses

Organizations must combine industry intelligence with internal expertise and operational data

The Future Role of Industry Reports

Looking ahead, industry reports will likely become even more integrated into corporate decision systems.

Future developments may include:

  • AI-generated industry forecasts
  • automated competitive intelligence monitoring
  • integrated market intelligence dashboards
  • predictive strategic planning tools

Rather than standalone documents, industry insights will increasingly function as continuous intelligence streams embedded within business platforms.

Conclusion

Industry reports are no longer just informational resources. They are becoming powerful strategic tools that shape how organizations understand markets, compete with rivals, and plan for the future.

In an era defined by rapid change and intense competition, companies that leverage industry intelligence effectively gain a critical advantage.

Strategic decisions supported by reliable market insights are more resilient, more informed, and more likely to succeed.

Industry reports are evolving from research documents into essential components of modern business strategy.

For more Contact US

Feature Walkthrough Analytics for Better Product Adoption in 2026

For years, product teams focused heavily on building features but spent far less time understanding how users actually discovered and adopted those features. Walkthroughs and onboarding flows were often treated as simple tutorials helpful but not strategically measured.

That mindset is changing rapidly.

In 2026, feature walkthrough analytics is becoming a standard component of product development and user experience strategy. Product teams now measure how users interact with walkthroughs, how effectively they activate features, and how onboarding experiences influence long-term engagement.

Feature walkthroughs are no longer just instructional overlays. They are now measurable growth tools.

The Evolution of Feature Walkthroughs

Early software products relied primarily on documentation, FAQ pages, or video tutorials to explain functionality. Users were expected to explore interfaces and learn features independently.

Later, product teams introduced guided walkthroughs, including:

  • Tooltips explaining buttons
  • Step-by-step onboarding tours
  • Feature announcement pop-ups
  • Interactive product tours

While these improvements helped reduce confusion, many companies still lacked visibility into how users engaged with those walkthroughs.

Product teams could launch onboarding flows but they often had no way of knowing whether those flows actually worked.

Why Feature Walkthrough Analytics Matters

Feature walkthrough analytics provides data-driven insights into how users interact with onboarding experiences. Instead of assuming that guidance works, product teams can measure real outcomes.

This shift allows companies to answer key questions such as:

  • Do users complete onboarding tours?
  • Which steps cause users to drop off?
  • How quickly do users activate key features?
  • Which walkthroughs drive higher retention?
  • Are new features being discovered effectively?

These insights help teams continuously optimize product experiences.

Key Metrics in Feature Walkthrough Analytics

Modern product teams monitor several important indicators when evaluating walkthrough performance.

Walkthrough Completion Rate

This metric tracks how many users finish an onboarding sequence.

Low completion rates often indicate:

  • Too many steps
  • Confusing instructions
  • Poor timing of walkthrough triggers

Optimizing completion rates improves early product adoption.

Feature Activation Rate

Activation rate measures how many users actually use a feature after being guided through a walkthrough.

High activation rates signal effective onboarding.

Low activation rates may indicate that:

  • The feature is difficult to understand
  • The walkthrough lacks clarity
  • The feature does not solve a meaningful user problem

Time to First Value

Time to first value measures how quickly users experience meaningful benefits from a product.

Feature walkthrough analytics helps reduce this timeline by guiding users toward impactful features earlier in the journey.

The faster users reach value, the higher the retention rate.

Walkthrough Drop-Off Points

Analyzing where users exit a walkthrough provides critical insights into usability problems.

Common causes of drop-off include:

  • Overly long onboarding flows
  • Irrelevant feature explanations
  • Poor user interface design
  • Cognitive overload

Shorter, focused walkthroughs often perform better.

Feature Adoption Rate

Feature adoption analytics measure how many users incorporate a feature into regular workflows after onboarding.

This metric helps product teams determine whether a feature provides sustained value or requires redesign.

Feature Walkthrough Analytics and Product-Led Growth

Many modern SaaS companies operate under a product-led growth (PLG) model, where the product itself drives acquisition, activation, and expansion.

In PLG environments, feature walkthroughs play a critical role in:

  • Educating new users
  • Encouraging feature discovery
  • Driving upgrades
  • Reducing customer support demand

Walkthrough analytics ensures that onboarding experiences contribute directly to growth metrics.

Behavioral Triggers and Contextual Walkthroughs

Feature walkthrough analytics also enable more intelligent onboarding strategies.

Instead of forcing every user through the same product tour, modern platforms use behavioral triggers.

Walkthroughs can activate when:

  • A user opens a feature for the first time
  • A user completes a milestone
  • A user struggles with a workflow
  • A new feature is introduced

This context-aware guidance improves engagement and reduces friction.

Micro-Walkthroughs: The New Standard

Traditional onboarding tours often contained long sequences of steps that overwhelmed users.

Today, many companies are replacing these with micro-walkthroughs short, targeted guidance moments tied to specific features.

Micro-walkthroughs provide:

  • Faster learning experiences
  • Lower cognitive load
  • Higher completion rates
  • More contextual help

Analytics confirms that smaller, focused guidance moments perform better than lengthy tutorials.

The Role of Product Analytics Platforms

Modern analytics platforms now integrate directly with feature walkthrough systems. These tools track user behavior across the entire onboarding journey.

Product teams can combine walkthrough analytics with:

  • User session recordings
  • Funnel analysis
  • Cohort analysis
  • Retention metrics

This integrated view provides deeper insights into product adoption patterns.

Benefits for Product Teams

Companies that implement feature walkthrough analytics gain several advantages.

Improved User Onboarding

Analytics-driven improvements help remove friction in early product experiences.

Faster Feature Adoption

Clear guidance increases the likelihood that users explore and adopt advanced features.

Reduced Support Costs

Better onboarding reduces the number of help requests and support tickets.

Higher User Retention

When users quickly understand product value, they are more likely to remain active customers.

Challenges in Implementing Walkthrough Analytics

Despite its advantages, implementing walkthrough analytics requires careful planning.

Some challenges include:

  • Avoiding excessive guidance that annoys users
  • Ensuring analytics data remains actionable
  • Aligning onboarding flows with real user workflows
  • Maintaining consistency across product updates

Successful companies treat walkthrough analytics as an ongoing optimization process rather than a one-time implementation.

The Future of Feature Walkthrough Analytics

Looking ahead, feature walkthrough analytics will likely become even more intelligent.

Emerging trends include:

  • AI-driven onboarding recommendations
  • Predictive feature adoption modeling
  • Automated walkthrough optimization
  • Personalized guidance experiences

Product teams will increasingly rely on analytics to design onboarding experiences that evolve with user behavior.

Conclusion

Feature walkthrough analytics is becoming a standard practice because modern product teams need measurable insights into how users learn and adopt software.

Walkthroughs are no longer static tutorials. They are dynamic product adoption systems that influence activation, retention, and growth.

By measuring completion rates, activation metrics, and adoption patterns, organizations can continuously improve onboarding experiences and unlock the full value of their products.

In the product-led era, successful companies do not just build features they ensure users actually discover and use them.

Feature walkthrough analytics makes that possible.

For more Contact Us

Runtime Security Is Overtaking Static-Only Approaches

For more than a decade, application security programs were built primarily around static analysis. Security teams scanned code before deployment, generated vulnerability reports, and sent findings back to developers for remediation. This “scan → fix → release” cycle became standard practice across enterprises.

But in 2026, that model alone is no longer sufficient.

Modern applications are dynamic, distributed, API-driven, and continuously deployed. Static testing still plays an important role but it cannot keep up with real-time threats, cloud-native complexity, and evolving attack techniques.

As a result, runtime security is overtaking static-only approaches as the dominant strategy in modern application security.

Security is shifting from prediction to protection.

The Traditional Static Security Model

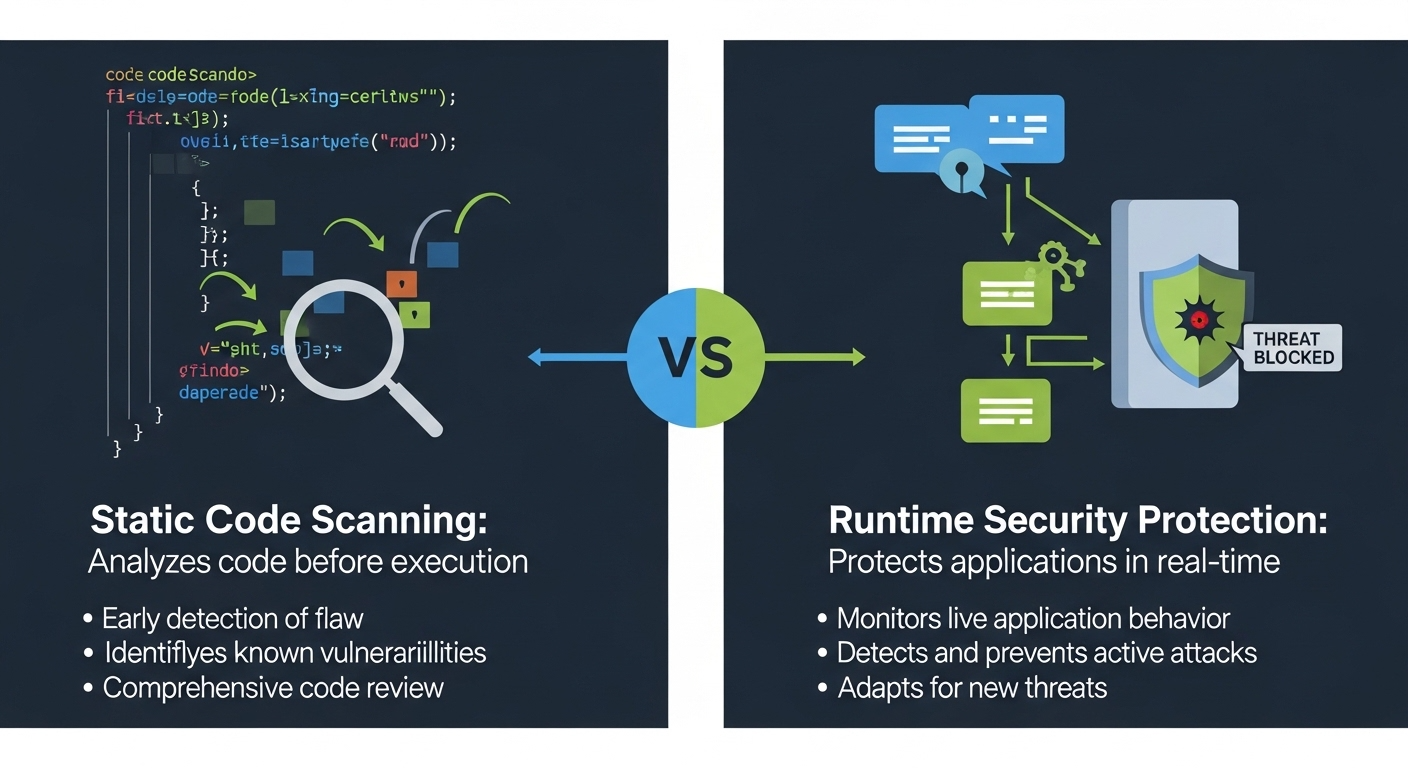
Static Application Security Testing (SAST) analyzes source code without executing it. It identifies patterns that may represent vulnerabilities, such as:

  • SQL injection risks
  • Cross-site scripting flaws
  • Hard-coded credentials
  • Unsafe memory handling
  • Known vulnerable dependencies

The strength of static testing lies in early detection. By scanning code before release, teams can reduce risk before deployment.

However, static analysis has inherent limitations.

The Structural Limitations of Static-Only Security

1. Lack of Runtime Context

Static tools analyze code in isolation. They cannot see:

  • How services interact at runtime
  • Whether vulnerable code paths are actually reachable
  • Which APIs are publicly exposed
  • How user roles affect access control

Without runtime context, risk assessment becomes theoretical.

2. High False Positive Rates

Security teams often spend significant time triaging findings that may not be exploitable in practice. This creates:

  • Alert fatigue
  • Remediation delays
  • Developer frustration
  • Reduced trust in security tools

When everything looks critical, nothing feels urgent.

3. Inability to Detect Business Logic Abuse

Many modern attacks do not exploit coding flaws they exploit flawed workflows.

For example:

  • Manipulating pricing logic
  • Bypassing rate limits
  • Abusing API sequencing
  • Circumventing authentication flows

Static analysis cannot simulate or detect these runtime abuses.

4. Cloud-Native and Microservices Complexity

Modern systems include:

  • Containers
  • Serverless functions
  • Dynamic infrastructure
  • Third-party APIs
  • Continuous deployments

Static scans performed before deployment cannot account for configuration drift, environment variables, or evolving infrastructure states.

Why Runtime Security Is Gaining Dominance

Runtime security shifts the focus from code inspection to live behavioral monitoring.

Instead of asking:

“Could this code be vulnerable?”

Runtime security asks:

“Is this vulnerability being exploited right now?”

This shift offers several advantages.

Real-Time Threat Detection

Runtime systems monitor live traffic and execution patterns. They can detect:

  • Injection attempts
  • API abuse
  • Token manipulation
  • Privilege escalation
  • Suspicious request patterns
  • Exploit payload signatures

This allows organizations to block threats instantly rather than discovering them after damage occurs.

Context-Aware Risk Evaluation

Runtime protection evaluates:

  • User identity and permissions
  • Network exposure
  • Deployment environment
  • Data sensitivity
  • Active exploit behavior

This contextual intelligence allows security teams to prioritize genuine threats over theoretical risks.

Runtime Application Self-Protection (RASP)

RASP solutions embed directly into the application runtime environment. They:

  • Monitor execution
  • Detect malicious behavior
  • Block exploit attempts in real time

Unlike perimeter defenses, RASP protects applications internally even if attackers bypass external controls.

Interactive Application Security Testing (IAST)

IAST operates during testing phases but leverages runtime instrumentation. It provides deeper insight into:

  • Code coverage during tests
  • Real execution paths
  • Confirmed vulnerabilities

IAST bridges the gap between static and dynamic testing.

Runtime Protection and DevSecOps

As organizations adopt DevSecOps and continuous deployment, security must operate at the same speed as development.

Runtime protection supports:

  • Rapid release cycles
  • Frequent feature updates
  • Continuous validation
  • Immediate feedback loops

Security becomes an always-on layer rather than a pre-release checkpoint.

Business Impact of Runtime Security

The shift toward runtime security is not purely technical it is strategic.

Revenue Protection

Production attacks directly affect transactions, subscription renewals, and user trust. Runtime blocking mechanisms reduce financial loss.

Reduced Incident Response Time

By detecting and blocking attacks instantly, runtime security lowers:

  • Mean Time to Detect (MTTD)
  • Mean Time to Respond (MTTR)

Faster containment reduces operational disruption.

Compliance and Regulatory Alignment

Modern compliance frameworks increasingly require:

  • Continuous monitoring
  • Active incident detection
  • Real-time reporting capabilities

Runtime security supports these mandates.

Runtime vs Static: A Layered Strategy

It is important to emphasize that runtime security does not eliminate the need for static analysis.

A mature strategy includes:

  • SAST for early code review
  • DAST for simulated attack testing
  • IAST for execution-aware scanning
  • RASP for production protection
  • Dependency scanning for supply chain security

The key difference in 2026 is prioritization. Static-only strategies are no longer enough.

Runtime validation is becoming central.

Emerging Trends in Runtime Security

AI-Driven Behavioral Detection

Machine learning models now analyze traffic anomalies and detect patterns that traditional rule-based systems miss.

Zero-Trust Runtime Policies

Applications enforce strict access controls internally, verifying every request based on identity and context.

Runtime Security Observability

Security metrics are increasingly integrated into observability dashboards alongside performance and reliability metrics.

This unifies security, operations, and engineering teams.

Challenges to Adoption

Runtime protection introduces considerations:

  • Performance overhead concerns
  • Integration complexity
  • Need for skilled interpretation of alerts
  • Balancing automation with human oversight

However, as tooling matures, these barriers are decreasing.

The Future of Application Security

The future of application security is:

  • Continuous
  • Context-aware
  • Runtime-driven
  • Business-aligned

Security will increasingly operate inside the application itself, monitoring execution behavior rather than relying solely on pre-deployment predictions.

Applications will defend themselves dynamically.

Conclusion

Static analysis established the foundation of secure development practices. But in today’s fast-moving, cloud-native environments, it cannot stand alone.

Runtime security provides real-time visibility, contextual intelligence, and active protection against modern threats.

The organizations that succeed in 2026 and beyond will adopt layered strategies but they will prioritize runtime defense as a core capability.

Static testing identifies potential weaknesses.
Runtime security stops real attacks.

The shift is not optional. It is evolutionary.

For more Contact US

7 Powerful Reasons Profitability Consulting Is Replacing Growth-Only Advisory

For more than a decade, startup consulting was heavily centered around one objective: growth. Advisors helped founders optimize acquisition funnels, increase user signups, accelerate funding rounds, and expand market presence as quickly as possible.

Revenue growth was the primary metric. Profitability could wait.

In 2026, that mindset has shifted dramatically.

Profitability consulting is replacing growth-only advisory as investors, founders, and boards demand sustainable financial models instead of aggressive expansion at all costs. The new era of startup consulting prioritizes disciplined scaling, unit economics, and capital efficiency over vanity metrics.

Growth is still important but it must now be profitable growth.

The End of “Growth at Any Cost”

In the low-interest-rate era, startups were incentivized to prioritize market capture over margin discipline. Venture capital flowed aggressively, rewarding:

  • User growth
  • Market share
  • Brand visibility
  • Revenue multiples
  • Expansion speed

Startups often operated at heavy losses while justifying burn rates with projected future dominance.

That environment has changed.

Capital has become more selective. Investors now scrutinize:

  • Cash runway
  • Burn multiple
  • Gross margin stability
  • Customer acquisition efficiency
  • Contribution margin

Consulting models must adapt accordingly.

Why Profitability Consulting Is Rising

1. Investor Expectations Have Evolved

Investors now require startups to demonstrate:

  • Clear break-even timelines
  • Sustainable cost structures
  • Realistic valuation narratives
  • Financial resilience under downturn scenarios

Consultants are increasingly tasked with preparing startups for this scrutiny.

2. Market Conditions Demand Discipline

Economic volatility and increased competition mean startups cannot rely solely on external capital for survival.

Profitability consulting focuses on:

  • Expense rationalization
  • Operational efficiency
  • Pricing optimization
  • Margin forecasting

This creates businesses that can sustain growth without constant funding injections.

3. Valuation Multiples Are Compressing

In today’s environment, revenue growth alone does not justify high valuations. Investors now reward:

  • EBITDA visibility
  • Path-to-profitability clarity
  • Strong unit economics

Advisors who can structure profitability narratives enhance startup credibility.

What Profitability Consulting Includes

Modern startup consulting now emphasizes measurable financial frameworks.

Unit Economics Optimization

Consultants analyze:

  • Customer Acquisition Cost (CAC)
  • Lifetime Value (LTV)
  • Contribution margin
  • Churn impact
  • Retention cohorts

Improving these metrics directly impacts sustainable growth.

Pricing Strategy Refinement

Pricing is often under-optimized in early-stage companies. Profitability consultants:

  • Test pricing tiers
  • Introduce value-based pricing
  • Optimize subscription models
  • Reduce discount dependency

Small pricing adjustments can dramatically increase margins.

Burn Rate & Runway Planning

Startups must understand:

  • Monthly burn rate
  • Cash runway under multiple scenarios
  • Sensitivity analysis
  • Cost structure flexibility

Consultants help model best-case and worst-case forecasts to reduce financial surprises.

Margin Engineering

Rather than simply increasing revenue, profitability consulting focuses on:

  • Gross margin improvement
  • Vendor cost negotiation
  • Infrastructure cost optimization
  • Automation-driven cost reduction

Margin expansion often produces greater impact than pure revenue growth.

Growth vs Profitable Growth

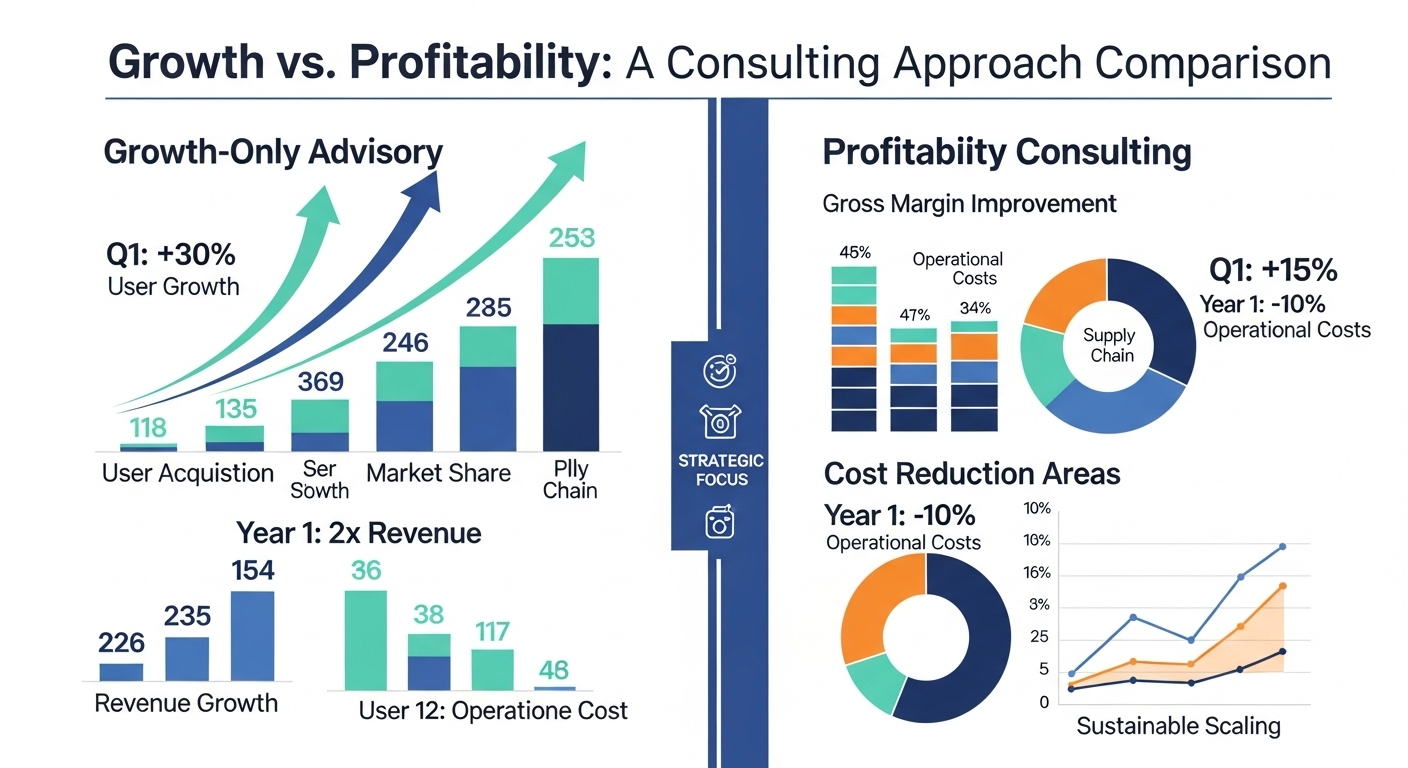
Growth-only advisory focuses on scale.

Profitability consulting focuses on sustainable scale.

The difference lies in:

Growth-Only AdvisoryProfitability Consulting
Prioritizes acquisitionPrioritizes retention efficiency
Encourages rapid expansionEncourages measured scaling
Accepts high burn ratesControls burn strategically
Focuses on top-line metricsFocuses on bottom-line health
Valuation-driven narrativeSustainability-driven narrative

This does not eliminate growth ambition it refines it.

The Strategic Role of Data in Profitability Consulting

Profitability consulting is inherently data-driven. Advisors now rely on:

  • Cohort analysis
  • Conversion rate diagnostics
  • Cost-to-serve modeling
  • Customer profitability segmentation
  • Scenario-based forecasting

Modern consulting is no longer theoretical it is analytical.

Fractional CFO & Embedded Advisory Models

The rise of profitability consulting has accelerated demand for:

  • Fractional CFO services
  • Financial modeling advisors
  • Embedded operational consultants

Rather than producing slide decks, consultants integrate into execution frameworks.

They:

  • Review monthly financial dashboards
  • Guide pricing experiments
  • Support investor reporting
  • Validate capital allocation decisions

Advisory becomes operational.

Benefits for Founders

Startups that embrace profitability consulting gain:

  • Greater investor confidence
  • Improved fundraising positioning
  • Longer runway
  • Reduced financial stress
  • Sustainable scaling foundation

Financial clarity improves strategic clarity.

Challenges in Transitioning from Growth to Profitability

Shifting mindset is not always easy.

1. Cultural Resistance

Teams accustomed to aggressive expansion may resist cost discipline.

2. Short-Term Revenue Pressure

Some profitability measures may initially slow growth momentum.

3. Organizational Realignment

Pricing changes and cost optimization require cross-functional coordination.

However, long-term stability outweighs short-term discomfort.

The Future of Startup Consulting

Startup consulting is becoming:

  • Financially rigorous
  • Operationally embedded
  • Data-driven
  • Capital-efficient
  • Risk-aware

Advisors who continue focusing solely on growth metrics risk becoming outdated.

The next generation of startup consulting integrates strategy with financial sustainability.

Conclusion

Profitability consulting is replacing growth-only advisory because the startup ecosystem has matured. Investors, founders, and markets now demand disciplined execution, efficient scaling, and sustainable financial models.

Growth without profitability is fragile.
Profitability without growth is stagnant.

The future belongs to startups that balance both.

Consultants who help founders engineer profitable growth not just rapid expansion will define the next era of startup success.
For more Contact Us

7 Critical AI-Powered Cyberattacks Trends Transforming Cybersecurity in 2026

AI-Powered Cyberattacks are no longer theoretical risks. These AI-Powered Cyberattacks are actively reshaping how modern breaches occur across cloud, API, and enterprise environments. AI-powered cyberattacks are accelerating, reshaping the global threat landscape and forcing organizations to rethink how they approach application security.

Cybercriminals are no longer relying solely on manual exploitation techniques. Instead, they are deploying AI systems capable of automating reconnaissance, crafting hyper-personalized phishing attacks, generating malware variants, and moving laterally across enterprise networks in minutes.

This is not just an evolution of cybercrime it is a scale shift.

The Speed Problem: Attacks Are Moving Faster Than Ever

Recent threat intelligence reports from firms like CrowdStrike highlight a disturbing trend: attackers are now moving within compromised environments in under 30 minutes.

Traditionally, breaches followed a slower pattern:

  1. Initial compromise
  2. Manual reconnaissance
  3. Privilege escalation
  4. Data exfiltration

With AI, this lifecycle is compressed dramatically. Automation allows attackers to:

  • Identify weak endpoints instantly
  • Scan internal systems for misconfigurations
  • Escalate privileges using known patterns
  • Deploy ransomware without delay

The reduced dwell time leaves security teams with a shrinking response window.

How AI Is Supercharging Cybercrime

AI enhances nearly every phase of the attack lifecycle.

1. AI-Driven Reconnaissance

AI-Powered Cyberattacks attackers use machine learning tools to scrape public data, analyze employee profiles on social media, and map digital infrastructure footprints. AI can process vast datasets quickly, identifying exploitable entry points more efficiently than manual attackers.

2. Hyper-Personalized Phishing

Generative AI models can mimic corporate tone, executive communication styles, and industry terminology. Phishing emails now:

  • Contain fewer grammatical errors
  • Reference specific projects or colleagues
  • Use contextual data from breached datasets

This significantly increases click-through and credential theft rates.

3. Automated Malware Development

AI can:

  • Modify malware signatures dynamically
  • Generate polymorphic code
  • Test exploit payloads against detection systems

Instead of manually coding malicious software, attackers can instruct AI tools to create variants that evade signature-based detection.

4. Lateral Movement at Machine Speed

Once inside a system, AI-driven scripts analyze network architecture, identify privilege escalation opportunities, and pivot across endpoints quickly. Automation reduces human error and increases precision.

This explains why modern breaches escalate so rapidly

Why Application Security Is Especially at Risk

Application security teams are under increasing pressure because modern software environments are complex:

  • Cloud-native architectures
  • Microservices and APIs
  • Rapid DevOps release cycles
  • Open-source dependencies
  • AI-assisted coding tools

Each component introduces potential vulnerabilities. Attackers use automated scanners to test thousands of endpoints simultaneously.

Unpatched APIs, misconfigured cloud storage, and exposed credentials become easy targets.

Organizations relying on reactive patch management are especially vulnerable.

The AI Arms Race in Cybersecurity

The cybersecurity ecosystem is now engaged in an AI arms race.

While attackers use AI offensively, defenders are deploying AI defensively.

Security vendors like Palo Alto Networks, Microsoft, and CrowdStrike are integrating machine learning into:

  • Behavioral anomaly detection
  • Endpoint threat monitoring
  • Automated threat hunting
  • Predictive risk modeling
  • Security information and event management (SIEM) systems

AI-powered defense systems can detect suspicious behavior patterns rather than relying solely on known attack signatures.

However, automation benefits both sides and attackers often experiment faster.

Business Impact: Beyond IT Departments

AI-powered cyberattacks have enterprise-wide consequences.

Financial Risk

  • Ransomware payouts
  • Operational downtime
  • Incident response costs
  • Regulatory fines

Reputational Damage

Customers lose trust when data breaches expose personal information.

Legal Exposure

Data privacy regulations increase liability for compromised user data.

Competitive Loss

Intellectual property theft can undermine years of research and development.

Small and mid-sized businesses face heightened risk because they often lack advanced monitoring infrastructure.

Emerging AI-Driven Threat Trends

Looking ahead, we can expect:

1. Autonomous Attack Bots

Self-learning attack systems capable of adapting in real time.

2. AI Deepfake Social Engineering

Voice and video impersonation targeting executives and finance teams.

3. Continuous Vulnerability Discovery

AI scanning open-source repositories and public assets for zero-day opportunities.

4. Credential Harvesting at Scale

AI analyzing breached datasets to identify password reuse patterns.

The sophistication of attacks will increase alongside accessibility of AI tools.

How Organizations Must Respond

To counter AI-powered threats, companies must evolve beyond traditional security practices.

1. Adopt AI-Driven Security Solutions

Behavior-based detection can identify unusual system activity before damage escalates.

2. Implement Zero Trust Architecture

Restrict access permissions and verify identity continuously.

3. Strengthen Secure Development Practices

Integrate automated code scanning into CI/CD pipelines.

4. Reduce Attack Surface

Audit APIs, cloud storage, and third-party integrations regularly.

5. Prioritize Incident Response Readiness

Automated containment tools can isolate compromised systems immediately.

6. Invest in Employee Awareness

AI-enhanced phishing attacks demand heightened human vigilance.

The Future of Application Security

Cybersecurity strategies must transition from reactive to predictive.

Instead of waiting for alerts, AI-powered defense systems will:

  • Anticipate vulnerabilities
  • Model attack simulations
  • Recommend remediation actions
  • Continuously adapt to emerging threat patterns

Application security will become deeply integrated into DevSecOps processes, ensuring vulnerabilities are addressed before deployment.

Conclusion

AI-powered cyberattacks are accelerating at an unprecedented rate, transforming the digital threat landscape. Automation, machine learning, and generative AI are empowering attackers with tools that increase speed, precision, and scale.

But the solution is not to resist AI it is to harness it responsibly.

Organizations that adopt intelligent security frameworks, invest in AI-driven defenses, and embed security into every layer of application development will be best positioned to thrive in this new era.

In 2026 and beyond, cybersecurity will not be defined by who builds the strongest walls but by who deploys the smartest systems. AI-Powered Cyberattacks represent one of the most critical cybersecurity challenges of 2026.

For more Contact US

Quality Engineering Metrics Integrated Into Business KPIs

For many years, quality engineering operated behind the scenes. Teams focused on reducing defects, increasing automation coverage, improving regression efficiency, and maintaining release stability. These metrics were critical to engineering teams but rarely made their way to boardrooms. Quality engineering metrics are becoming central to business strategy as organizations connect software performance directly to financial outcomes.

That separation no longer exists.

In 2026, quality engineering metrics are being integrated directly into business KPIs. Executives now understand that software quality influences revenue performance, customer retention, operational risk, brand reputation, and competitive advantage.

Quality is no longer a technical report. It is a strategic business indicator.

The Evolution of Quality Engineering

Phase 1: Bug Detection

Quality teams were primarily responsible for finding defects before release.

Phase 2: Automation and Efficiency

Organizations invested in automation to accelerate release cycles and reduce manual effort.

Phase 3: Continuous Delivery Integration

Quality shifted left and right, embedding testing into CI/CD pipelines and production monitoring.

Phase 4: Business Alignment (Current Phase)

Quality metrics now correlate directly with financial and operational KPIs.

This evolution reflects the reality that digital products are no longer support functions they are primary revenue engines.

How Quality Engineering Metrics Drive Business Performance

1. Software Is Revenue Infrastructure

In retail, e-commerce platforms drive transactions.
In fintech, apps process financial activity.
In SaaS, uptime determines subscription retention.

A defect in production is no longer an inconvenience it is a financial event.

Executives now ask:

  • How much revenue is at risk due to quality gaps?
  • What is the cost per hour of downtime?
  • How do defects affect customer lifetime value?

Quality engineering must answer these questions with measurable data.

2. Customer Experience Defines Brand Value

Customers no longer differentiate between technical failures and brand failures. A broken feature or slow-loading page directly impacts perception.

Quality metrics now include:

  • User journey stability
  • Page load performance
  • Conversion impact after release
  • Feature adoption consistency

These are business metrics disguised as quality signals.

3. Digital Risk Is Board-Level Risk

Cyber incidents, outages, and performance failures are now governance concerns. Boards expect transparency into:

  • Change failure rate
  • Incident frequency
  • Recovery time
  • Release risk level

Quality engineering has become a risk management function.

Mapping Quality Metrics to Business KPIs

To align quality with business strategy, organizations are redefining traditional metrics.

1. Defect Escape Rate → Revenue Risk Index

Rather than simply reporting escaped bugs, teams now calculate:

  • Revenue lost per incident
  • Conversion drop during outage
  • Refund and compensation impact
  • Customer churn associated with defects

Quality data feeds financial forecasting models.

2. Change Failure Rate → Operational Stability KPI

Frequent rollback events reduce trust and slow innovation. Organizations measure:

  • Percentage of deployments causing incidents
  • Cost of remediation
  • Delays in feature rollout

This aligns DevOps metrics with executive performance dashboards.

3. Mean Time to Detect (MTTD) & Mean Time to Recover (MTTR) → Customer Retention Signal

Faster detection reduces impact. Faster recovery protects loyalty.

Companies now track:

  • Minutes of user impact
  • Retention drop during incidents
  • Support ticket volume spikes

Quality metrics become leading indicators of churn.

4. Automation Coverage → Cost Optimization Metric

Automation is reframed from coverage percentage to financial outcome:

  • Manual hours saved
  • Release cycle acceleration
  • Cost per deployment reduction

Automation investments are evaluated through ROI lenses.

The Role of Observability in Business-Driven Quality

Observability tools bridge the gap between technical signals and business outcomes.

Modern systems connect:

  • Error rates → Transaction failures
  • API latency → Abandoned sessions
  • Infrastructure instability → SLA penalties
  • Performance degradation → Revenue decline

This correlation transforms testing into real-time performance assurance.

Shift-right practices including canary releases, chaos engineering, and production validation enhance business alignment.

Modern enterprises now treat quality engineering metrics as leading indicators of revenue protection and customer trust.

Executive Dashboards: The New Quality Framework

Today’s leadership dashboards often include:

  • Revenue at risk due to current defects
  • Digital stability score
  • Release confidence index
  • SLA compliance percentage
  • Business impact of incidents
  • Customer sentiment after release

Quality now appears in quarterly business reviews and strategic planning sessions.

Cultural Transformation in Engineering Teams

Aligning quality metrics with business KPIs changes engineering culture.

From “Did Tests Pass?”

To:
“Did This Release Protect Revenue and Customer Trust?”

Engineers become outcome-focused rather than output-focused.

Quality teams collaborate more closely with:

  • Product management
  • Finance teams
  • Customer success teams
  • Risk management teams

Quality becomes cross-functional.

Challenges in Integrating Quality and Business Metrics

Despite the benefits, integration presents obstacles.

1. Data Integration Complexity

Correlating engineering data with financial systems requires unified analytics platforms.

2. Metric Overload

Too many metrics can dilute focus. Strategic prioritization is essential.

3. Cultural Resistance

Some engineering teams resist outcome-based evaluation. Leadership alignment is necessary.

Successful implementation requires both technological capability and cultural maturity.

The Strategic Advantage of Business-Aligned Quality

Organizations that integrate quality metrics into business KPIs gain:

  • Clear visibility into digital risk exposure
  • Faster decision-making during incidents
  • Improved release confidence
  • Stronger investor confidence
  • More accurate revenue forecasting

Quality becomes predictive rather than reactive.

The Future of Quality Engineering

Looking ahead, we can expect:

  • AI-driven predictive defect models
  • Automated risk scoring for releases
  • Real-time quality-health indicators tied to business dashboards
  • Continuous validation integrated with product analytics

Quality engineering will increasingly function as a strategic intelligence layer within digital enterprises.

Conclusion

Quality engineering metrics are no longer confined to internal engineering reports. They are now central to business strategy, revenue protection, and customer trust.

By integrating quality signals into business KPIs, organizations move from defect detection to value preservation. They align technical excellence with financial performance and customer experience.

In today’s digital economy, quality is not just about preventing bugs. It is about safeguarding growth, stability, and competitive advantage.

Quality engineering is now a business discipline. As digital transformation accelerates, quality engineering metrics will continue shaping executive decision-making and long-term growth strategy.

For more information Connect with us

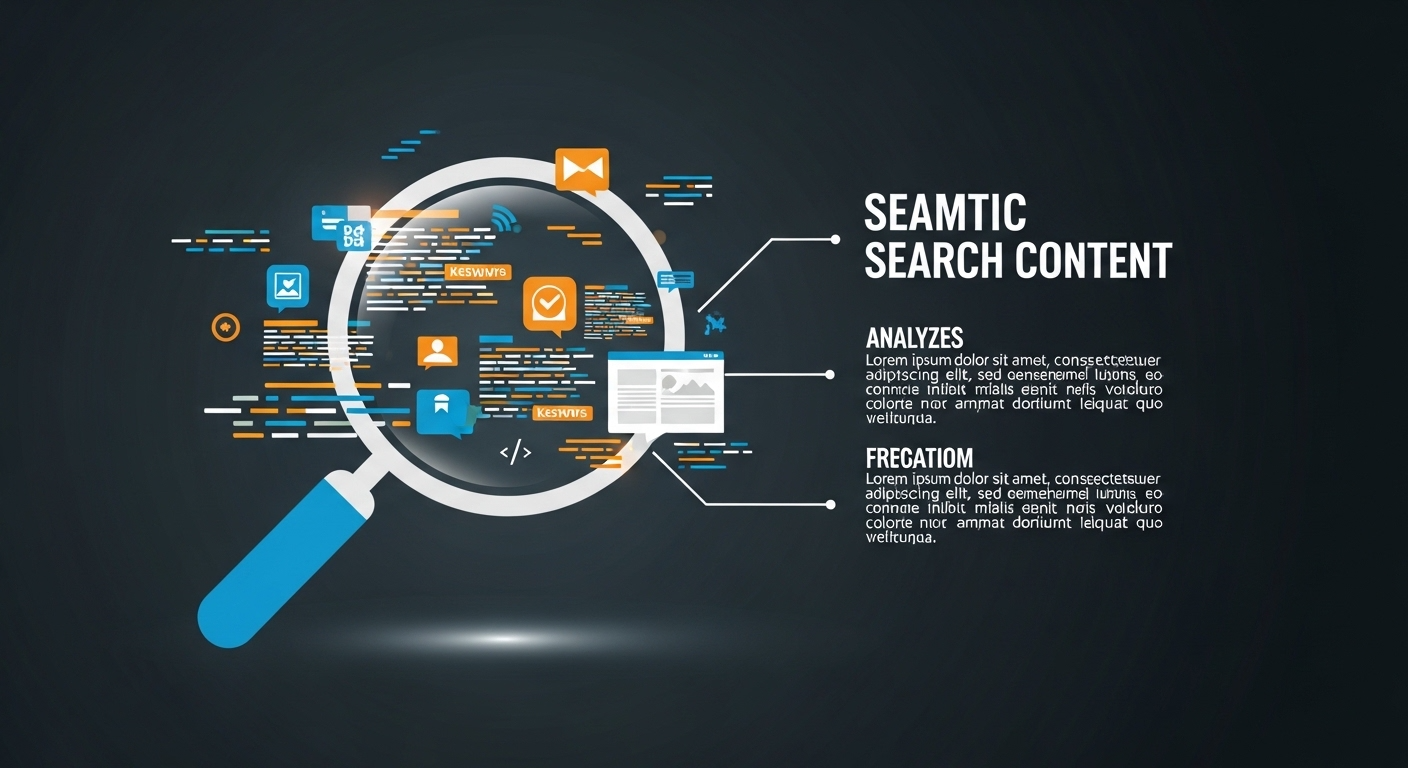
9 Proven Benefits of AI Search Integration for Better Content Discovery

AI search integration is transforming how content is discovered, summarized, and ranked in modern search engines. In 2026, search is no longer limited to keyword matching and blue links. Artificial intelligence now interprets intent, generates structured summaries, and reshapes how users interact with information online.

Instead of simply ranking pages, AI search systems analyze semantic relationships, contextual depth, and content structure before presenting answers directly within search interfaces. This shift is fundamentally changing content strategy and SEO practices.

This marks a major shift in content strategy. SEO is no longer only about visibility it is about participation in AI-driven discovery systems.

From Blue Links to Intelligent Answers

Traditional search results relied on ranking web pages as clickable blue links. Users would:

  1. Enter a query
  2. Browse results
  3. Click a page
  4. Extract information

Today, AI models summarize multiple sources and present direct answers within the search interface itself.

This transformation includes:

  • AI-generated summaries
  • Conversational search results
  • Multi-step guided answers
  • Follow-up question prompts
  • Context-aware recommendations

Content is now competing not just for rankings, but for inclusion in AI-generated responses.

How AI Search Integration Changes SEO Strategy

AI-driven search systems evaluate content differently. Instead of scanning for keyword frequency alone, they prioritize:

  • Conceptual depth
  • Entity relationships
  • Author credibility
  • Structured clarity
  • Context completeness

Content that is thin, repetitive, or surface-level is less likely to be surfaced in AI summaries.

In contrast, content that demonstrates clarity, expertise, and logical structure has higher chances of being referenced.

The Rise of Structured and Extractable Content

AI models rely heavily on structured data patterns. This means that content optimized for AI discovery typically includes:

  • Clear H2 and H3 headings
  • Bullet points
  • Numbered steps
  • FAQs
  • Definitions and explanations
  • Logical topic progression

Unstructured long paragraphs are harder for AI systems to parse and summarize accurately.

Content structure now directly influences discoverability.

Multimodal Discovery Is Expanding

Search is no longer purely text-based. AI integration supports:

  • Image interpretation
  • Video summarization
  • Voice queries
  • Conversational responses
  • Cross-platform search experiences

Content creators must consider multiple formats when designing assets.

For example:

  • A blog post may appear as a summarized snippet
  • An infographic may be extracted into a featured answer
  • A video transcript may inform conversational AI responses

Content discovery is now multi-layered.

The Impact on Click-Through Behavior

One of the most significant changes in AI-integrated search is its effect on traffic patterns.

Because AI answers often provide summaries directly in search results, users may not always click through to the original source.

This introduces new strategic questions:

  • How do brands maintain visibility if clicks decrease?
  • How should content provide value beyond summaries?
  • What motivates users to visit the full page?

The answer lies in depth and differentiation.

Surface-level answers may be summarized, but original insights, case studies, frameworks, and expert analysis still drive engagement.

As AI search integration evolves, content must be structured for extractability and semantic clarity rather than keyword repetition.

Authority Signals Matter More Than Ever

AI systems prioritize trustworthy sources. Signals that influence AI inclusion include:

  • Author expertise
  • Brand authority
  • Backlink credibility
  • Consistent publishing
  • Topical depth

Content ecosystems built around topic clusters perform better than isolated posts.

For example, rather than publishing a single article on SEO, organizations now build:

  • Core pillar content
  • Supporting subtopics
  • Case studies
  • Technical breakdowns
  • Expert commentary

AI favors comprehensive topical authority.

Organizations that understand AI search integration will outperform competitors still relying on traditional ranking tactics.

Topic Clusters Over Keywords

The integration of AI into search accelerates the shift from keyword-based SEO to intent-based SEO.

Instead of targeting individual search terms, successful strategies focus on:

  • Topic coverage
  • User journey alignment
  • Related question mapping
  • Contextual completeness

AI models connect ideas rather than matching isolated phrases.

Content strategy must reflect that evolution.

First-Party Engagement Signals Are Increasingly Important

With AI search integration reducing some click-through behavior, engagement quality becomes more critical.

Search engines now consider:

  • Time on page
  • Scroll depth
  • Repeat visits
  • Content interaction
  • Bounce rate

User satisfaction signals influence long-term ranking and visibility in AI systems.

SEO now overlaps more closely with UX and content experience design.

The Role of AI in Content Creation

AI is not only transforming search it is also influencing content production.

Content teams now use AI tools for:

  • Topic ideation
  • Outline structuring
  • Keyword clustering
  • Content optimization suggestions
  • Performance forecasting

However, AI-generated content alone is insufficient.

AI integration in search systems favors originality, expertise, and differentiated insight not generic summaries.

Human-driven strategic thinking remains essential.

Challenges of AI Search Integration

Despite its benefits, AI-driven search introduces challenges:

1. Reduced Traffic Transparency

Summarized results may obscure referral patterns.

2. Attribution Complexity

AI-generated answers may aggregate multiple sources without clear credit.

3. Increased Competition for Authority

Brands must compete not only for ranking but for inclusion in summary models.

Organizations must adapt measurement frameworks to account for new discovery dynamics.

Strategic Recommendations for 2026

To succeed in AI-integrated search environments, organizations should:

  1. Build topic clusters, not isolated articles
  2. Structure content clearly for extractability
  3. Demonstrate expertise through case studies and data
  4. Use schema markup where appropriate
  5. Optimize for user intent rather than keyword density
  6. Focus on engagement depth beyond surface answers

The goal is not just ranking it is inclusion, authority, and sustained trust.

Conclusion

AI integration is reshaping content discovery at a structural level. Search engines are evolving from index-and-rank systems into interpret-and-answer systems.

This shift changes how content is evaluated, displayed, and consumed. Visibility now depends on semantic depth, structural clarity, and authority signals.

Organizations that adapt to AI-driven discovery models will maintain influence in the evolving search landscape. Those that rely solely on traditional SEO tactics risk declining visibility.

In the age of AI Search Integration, content strategy must be intelligent, structured, and authoritative.

Search is no longer about links. It is about understanding.

AI search integration is not a temporary shift it represents a permanent transformation in how digital content is evaluated and delivered.
For more Contact Us

Data Quality Scoring Is Becoming Standard, Not Optional

In the early days of machine learning and analytics, teams often rushed toward model training with one assumption: more data equals better results. Data pipelines were built quickly, datasets were collected from multiple sources, and models were trained with minimal inspection of data integrity.

That approach no longer works.

In 2026, data quality scoring is becoming a standard requirement before any model training or analytics deployment begins. Organizations are recognizing that poor data quality is one of the primary causes of model failure, inaccurate insights, and operational risk.

The shift is clear: data quality is no longer an afterthought it is a measurable prerequisite.

Why Data Quality Was Historically Overlooked

For years, data engineering focused primarily on:

  • Data ingestion speed
  • Storage scalability
  • Model accuracy metrics
  • Feature engineering optimization

Data quality checks were often limited to:

  • Missing value detection
  • Basic format validation
  • Schema matching

These checks were reactive and superficial. They did not measure whether the data was reliable, unbiased, consistent, or representative.

As machine learning systems became more integrated into real-world decision-making healthcare diagnostics, credit scoring, fraud detection, supply chain forecasting the cost of low-quality data became significantly higher.

What Is Data Quality Scoring?

Data quality scoring is a structured process that assigns measurable ratings to datasets before they are used for training or inference.

Rather than simply asking, “Is the data complete?”, modern scoring systems evaluate:

  • Completeness – Are critical fields missing?
  • Consistency – Are formats and values uniform across sources?
  • Accuracy – Does the data reflect real-world conditions?
  • Timeliness – Is the dataset up to date?
  • Distribution Stability – Has the data drifted from historical patterns?
  • Bias Detection – Does the dataset overrepresent certain groups?

Each dimension contributes to an overall quality score that determines whether the dataset is safe to use.

Why Data Quality Scoring Is Becoming Mandatory

1. Model Performance Depends on Input Integrity

Even the most advanced algorithms cannot compensate for flawed data. Low-quality inputs lead to:

  • Inconsistent predictions
  • Overfitting to noisy signals
  • Increased false positives or negatives
  • Model instability in production

By scoring data quality early, organizations prevent expensive rework.

2. Regulatory and Compliance Pressure

Industries such as finance, healthcare, and insurance face increasing scrutiny regarding algorithmic decisions.

Regulators now expect companies to demonstrate:

  • Data lineage
  • Bias mitigation practices
  • Validation frameworks
  • Audit trails

Data quality scoring provides documentation and defensibility.

3. AI Responsibility and Fairness Standards

Responsible AI practices now require dataset evaluation beyond performance metrics.

If a model is trained on biased or incomplete data, it can produce discriminatory outcomes. Data quality scoring incorporates fairness checks, ensuring datasets meet ethical and legal standards.

4. Cost Efficiency in ML Pipelines

Poor data often leads to:

  • Repeated training cycles
  • Increased debugging time
  • Deployment rollbacks
  • Production outages

Scoring datasets before model training reduces operational waste.

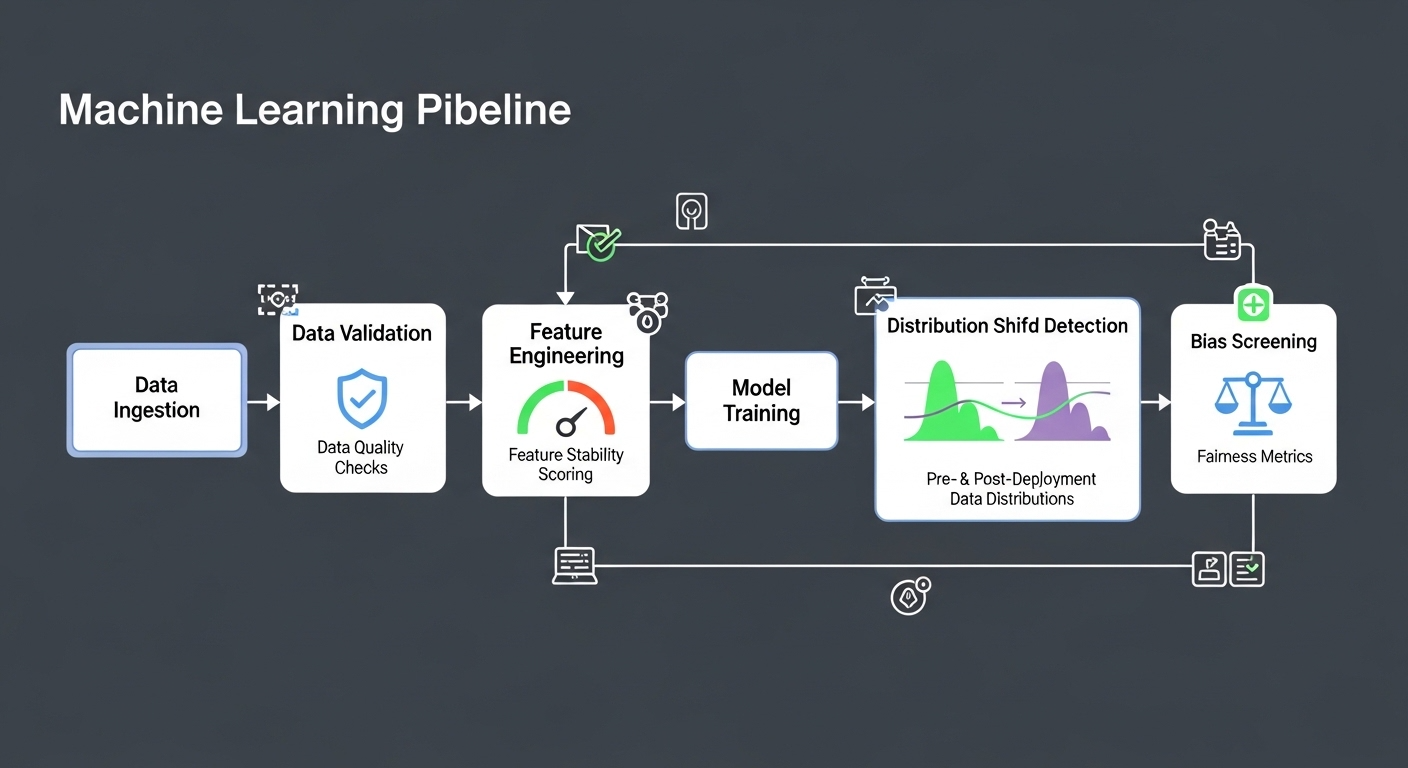
Key Components of Modern Data Quality Scoring Systems

Modern platforms integrate automated checks directly into data pipelines.

Automated Schema Validation

Ensures structure matches expected definitions.

Missing Value Impact Analysis

Measures how missing data affects model performance.

Distribution Shift Detection

Compares new data with historical baselines to detect drift.

Feature Reliability Index

Scores each feature based on stability and predictive contribution.

Bias and Fairness Screening

Identifies disproportionate representation across sensitive attributes.

These tools generate dashboards that allow data teams to approve or reject datasets before use.

Data Quality Scoring in Real-Time Systems

With the rise of real-time machine learning systems, static validation is insufficient.

Organizations are implementing:

  • Continuous data monitoring
  • Real-time anomaly detection
  • Streaming quality validation
  • Drift alerts before model degradation

Quality scoring is now ongoing not one-time.

The Cultural Shift: From Data Volume to Data Integrity

In the past, success was often measured by the size of a dataset.

Today, quality matters more than quantity.

High-integrity datasets enable:

  • Better generalization
  • Faster model convergence
  • More explainable predictions
  • Increased stakeholder trust

Data integrity has become a strategic asset.

Challenges in Implementing Data Quality Scoring

Despite its benefits, organizations face challenges:

1. Standardization Across Teams

Different teams may define “quality” differently.

2. Tool Integration

Integrating scoring tools into existing pipelines requires architectural planning.

3. False Confidence

A high data quality score does not guarantee perfect predictions. Human oversight remains essential.

However, the long-term gains outweigh these obstacles.

The Future of Data Quality Management

Looking forward, data quality scoring will evolve into:

  • AI-assisted quality diagnostics
  • Predictive quality degradation alerts
  • Self-healing data pipelines
  • Integrated governance dashboards

Eventually, data quality scoring will become as fundamental as version control in software development.

It will not be optional it will be embedded.

Conclusion

Data quality scoring is becoming standard because the cost of ignoring it is too high. As machine learning systems become more embedded in business-critical decisions, organizations must ensure that the foundation their data is reliable, fair, and consistent.

By implementing structured data quality scoring frameworks, companies reduce risk, improve model performance, and strengthen trust in AI-driven outcomes.

In modern machine learning, success begins before training starts. It begins with data integrity.

For more information Connect with us

Leadership Empathy Is Now Scored and Measured

For decades, leadership empathy was viewed as a soft, intangible quality admirable, but difficult to define and nearly impossible to measure. It appeared in leadership books, corporate values statements, and keynote speeches. Yet when it came to executive evaluations, compensation frameworks, and board-level reporting, empathy was largely absent.

That dynamic has changed.

In 2026, leadership empathy is being scored, benchmarked, and integrated into formal performance management systems. Organizations are no longer satisfied with anecdotal impressions of emotional intelligence. They are building structured systems to measure how leaders listen, respond, support, and guide their teams.

Empathy has shifted from a personality trait to a performance metric.

Why Leadership Empathy Has Become a Strategic Priority

Modern organizations operate in environments defined by uncertainty, digital acceleration, distributed teams, and generational workforce shifts. Employees are navigating constant change remote collaboration, automation, restructuring, market volatility, and heightened performance expectations.

In this context, leadership style directly impacts organizational stability.

Employees now expect leaders to:

  • Communicate transparently
  • Recognize emotional strain
  • Support work-life boundaries
  • Handle conflict constructively
  • Encourage diverse perspectives
  • Provide psychological safety

Research consistently demonstrates that empathetic leadership increases engagement, reduces burnout, and strengthens retention. However, organizations have recognized that informal encouragement is not enough. Measurement drives accountability and accountability drives consistency.

The Evolution From “Soft Skill” to Measurable Capability

The shift toward measuring empathy is rooted in a broader transformation in management philosophy. Historically, leadership performance was evaluated primarily on:

  • Revenue growth
  • Operational efficiency
  • Project delivery
  • Budget management

While these metrics remain important, they do not capture how leaders influence team morale, psychological safety, or long-term sustainability.

Modern leadership evaluation frameworks now incorporate behavioral indicators such as:

  • Listening responsiveness
  • Feedback receptiveness
  • Conflict resolution approach
  • Inclusivity in decision-making
  • Emotional awareness during crisis

Empathy is now seen as a multiplier it enhances the effectiveness of every other leadership skill.

How Organizations Are Measuring Leadership Empathy

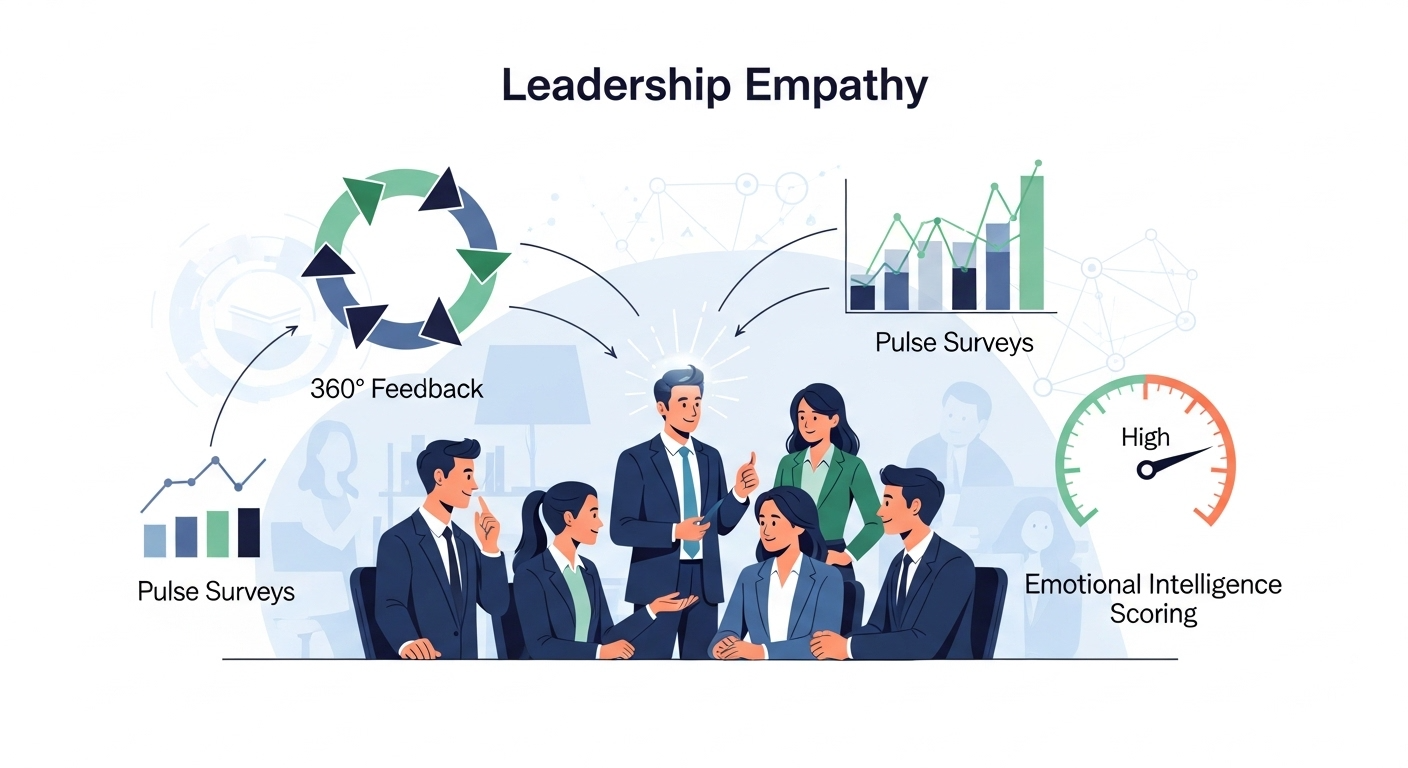
1. 360-Degree Emotional Intelligence Assessments

Multi-source feedback systems have become standard practice. These assessments collect data from:

  • Direct reports
  • Peers
  • Supervisors
  • Cross-functional collaborators

Participants evaluate leaders on behavioral competencies such as:

  • Active listening
  • Fair treatment
  • Stress management
  • Approachability
  • Respect for differing opinions

Aggregated results provide structured insight into how leadership behavior is perceived across the organization.

2. Real-Time Pulse Surveys

Many organizations now deploy short, frequent surveys integrated into internal platforms. These tools track:

  • Team sentiment
  • Perceived managerial support
  • Communication clarity
  • Psychological safety levels

Unlike annual engagement surveys, real-time pulse tools provide ongoing feedback, allowing organizations to identify trends and intervene early.

3. Empathy Metrics Linked to Leadership KPIs

Forward-thinking organizations are tying empathy-related scores to:

  • Performance reviews
  • Bonus eligibility
  • Promotion readiness
  • Leadership development plans

This formal integration ensures empathy is treated as a core competency rather than an optional quality.

4. Behavioral Analytics in Digital Communication

With the rise of remote work, digital communication has become central to leadership visibility. Some organizations are exploring:

  • Sentiment analysis in team communications
  • Response time metrics
  • Feedback loop participation rates

While these tools require careful ethical consideration, they reflect the seriousness with which empathy is being operationalized.

The Link Between Empathy and Psychological Safety

Psychological safety the ability to express ideas and concerns without fear is increasingly recognized as a performance driver.

Empathetic leaders contribute to psychological safety by:

  • Responding constructively to mistakes
  • Encouraging dissenting opinions
  • Modeling vulnerability
  • Demonstrating emotional self-regulation

When psychological safety improves, teams are more likely to:

  • Share innovative ideas
  • Raise risks early
  • Collaborate effectively
  • Adapt to change

Empathy strengthens organizational resilience.

The Business Impact of Measured Empathy

Measuring leadership empathy is not symbolic. It produces tangible business outcomes.

Organizations with high empathy scores often experience:

  • Lower voluntary turnover
  • Reduced absenteeism
  • Higher productivity
  • Stronger collaboration across departments
  • Improved customer satisfaction

Trust, built through empathetic leadership, accelerates decision-making and reduces friction. Teams aligned through trust execute faster and more efficiently.

In competitive markets, speed and cohesion create strategic advantage.

Addressing Concerns About Measuring Empathy

While the move toward quantification is beneficial, it raises valid concerns.

1, Oversimplification

Leadership Empathy cannot be reduced to a single score. Organizations must combine quantitative metrics with qualitative insights.

2. Bias and Subjectivity

Feedback systems must account for unconscious bias and cultural variation.

3. Balancing Empathy With Accountability

Effective leaders balance empathy with decisiveness. Measurement frameworks should avoid rewarding passivity under the guise of empathy.

Successful organizations design empathy metrics that reinforce constructive leadership, not avoidance of difficult decisions.

Leadership Development in the Age of Empathy Metrics

As empathy becomes measurable, leadership development programs are evolving.

Training now focuses on Leadership Empathy :

  • Emotional intelligence coaching
  • Active listening exercises
  • Conflict navigation techniques
  • Bias awareness
  • Stress regulation strategies

Development pathways are informed by empathy assessment results, creating personalized growth plans for leaders.

This data-driven development approach ensures continuous improvement rather than one-time training events.

Generational Expectations and Empathy

Millennial and Gen Z professionals place high value on:

  • Transparent communication
  • Work-life integration
  • Inclusive environments
  • Authentic leadership

Organizations that ignore these expectations risk losing talent. Measuring empathy signals commitment to modern workforce priorities.

Empathy is no longer optional it is an expectation.

The Future of Empathy Measurement

Looking ahead, empathy measurement will likely evolve further.

Emerging trends include:

  • AI-assisted sentiment analytics
  • Continuous micro-feedback tools
  • Leadership dashboards integrating emotional intelligence data
  • Predictive analytics linking empathy scores to retention risk

Leadership evaluation will become increasingly holistic, combining operational performance with behavioral impact.

Empathy will remain central to that framework.

Conclusion

Leadership empathy has transitioned from an abstract ideal to a measurable, accountable leadership capability. By embedding empathy into evaluation systems, organizations transform culture from aspiration to structure.

Measuring empathy strengthens trust, supports psychological safety, improves retention, and enhances performance. It aligns leadership behavior with modern workforce expectations and long-term strategic goals.
In 2026 and beyond, leadership will not be judged solely by outcomes, but by the manner in which those outcomes are achieved.

Empathy is no longer invisible. It is part of the scorecard.

For more information Connect with us